
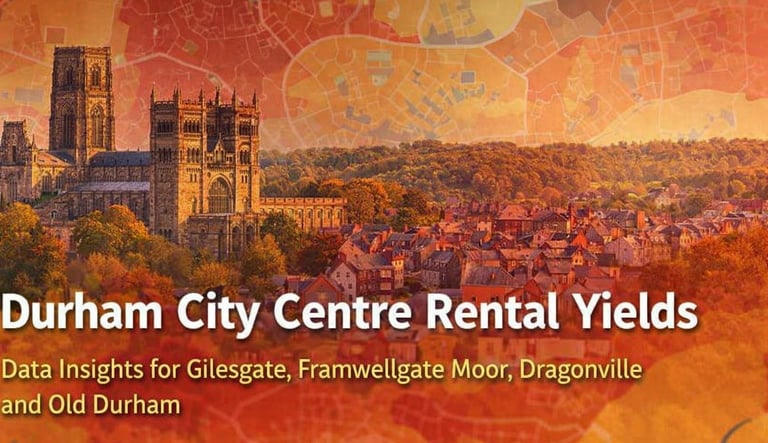
Durham City Centre Rental Yields | North East Property
Explore Durham City Centre rental yields in 2026. Data-led insight into Gilesgate, Framwell Gate Moor, Dragon Ville and Old Durham.
Durham City Centre Rental Yields: What the Data Really Shows in 2026
Understanding rental performance in Durham has never been more important for landlords and property investors. While headline averages can be useful, they rarely tell the full story. Recent 12-month gross yield heat map data highlights a key reality of the Durham rental market:
Rental yields are highly street-specific, not postcode-specific.
Using data-led tools alongside on-the-ground experience, we can see clear differences in performance across areas that sit just minutes apart.
Why Gross Yield Still Matters
Gross yield is not the only metric investors should rely on, but it remains a useful starting point when assessing:
Entry price versus rental income
Demand strength in specific locations
Relative performance between nearby areas
When combined with local knowledge, yield data helps landlords make better-informed decisions, rather than relying on assumptions or outdated benchmarks.
Durham City Centre: A Micro-Market, Not One Market
Durham City Centre and its surrounding neighbourhoods behave less like a single market and more like a collection of micro-markets, each with its own dynamics.
Recent 12-month data highlights notable differences across areas including Gilesgate, Framwellgate Moor, Dragonville, and parts of Old Durham.
Indicative Rental Yield Ranges (12-Month View)
Figures below represent typical gross yield ranges based on recent market data and local performance trends. Actual results vary by street, property type, and condition.
Gilesgate
Approx. 7.5%–9% gross yield
Strong demand from professionals, sharers, and students
Low void periods where properties are priced correctly
Performance varies significantly by street and layout
Framwellgate Moor
Approx. 6.5%–8% gross yield
Popular with families and longer-term tenants
Offers stability and lower turnover
Often favoured by landlords prioritising consistency over headline yield
Dragonville
Approx. 6%–7.5% gross yield
Strong appeal due to transport links and retail amenities
Newer housing stock typically means lower maintenance costs
Good option for investors seeking balance rather than maximum yield
Old Durham (Select Pockets)
Approx. 8%–10% gross yield
Higher yields driven by lower purchase prices
Performance is highly dependent on exact location
Careful due diligence is essential
What This Means for Landlords
The data reinforces several important points:
Purchase price alone doesn’t determine performance
Tenant demand, layout, and presentation are critical
Two similar properties nearby can deliver very different returns
Rents should be reviewed regularly against local data
Landlords relying on historic rent levels or broad averages may be underperforming without realising it.
What This Means for Investors
For investors considering Durham:
Yield opportunities still exist
Data-led decisions reduce risk
Micro-location matters more than ever
Durham remains an attractive buy-to-let location, but success increasingly comes down to buying well, pricing realistically, and managing professionally.
Data Alone Isn’t Enough
While heat maps and yield data provide valuable insight, they should never be used in isolation.
Local factors such as:
Street reputation
Tenant profiles
Property condition
Management quality
all play a major role in real-world performance.
At North East Property, we combine data-led analysis with local, hands-on experience to help landlords and investors understand what’s really happening — not just what the averages suggest.
Thinking About a Rental in Durham?
Whether you’re:
Reviewing an existing rental
Considering a buy-to-let purchase
Reassessing rent levels
Planning your next investment
Having a street-level understanding of the market can make a significant difference.
If you’d like an honest, location-specific view of Durham’s rental market, we’re happy to help.
© Northeast Property 2026. Northeast Property is a trading name of Northeast Starlight Property Limited, registered in England and Wales at 334 High Street, Jarrow NE32 3BH (company number 15227296)


